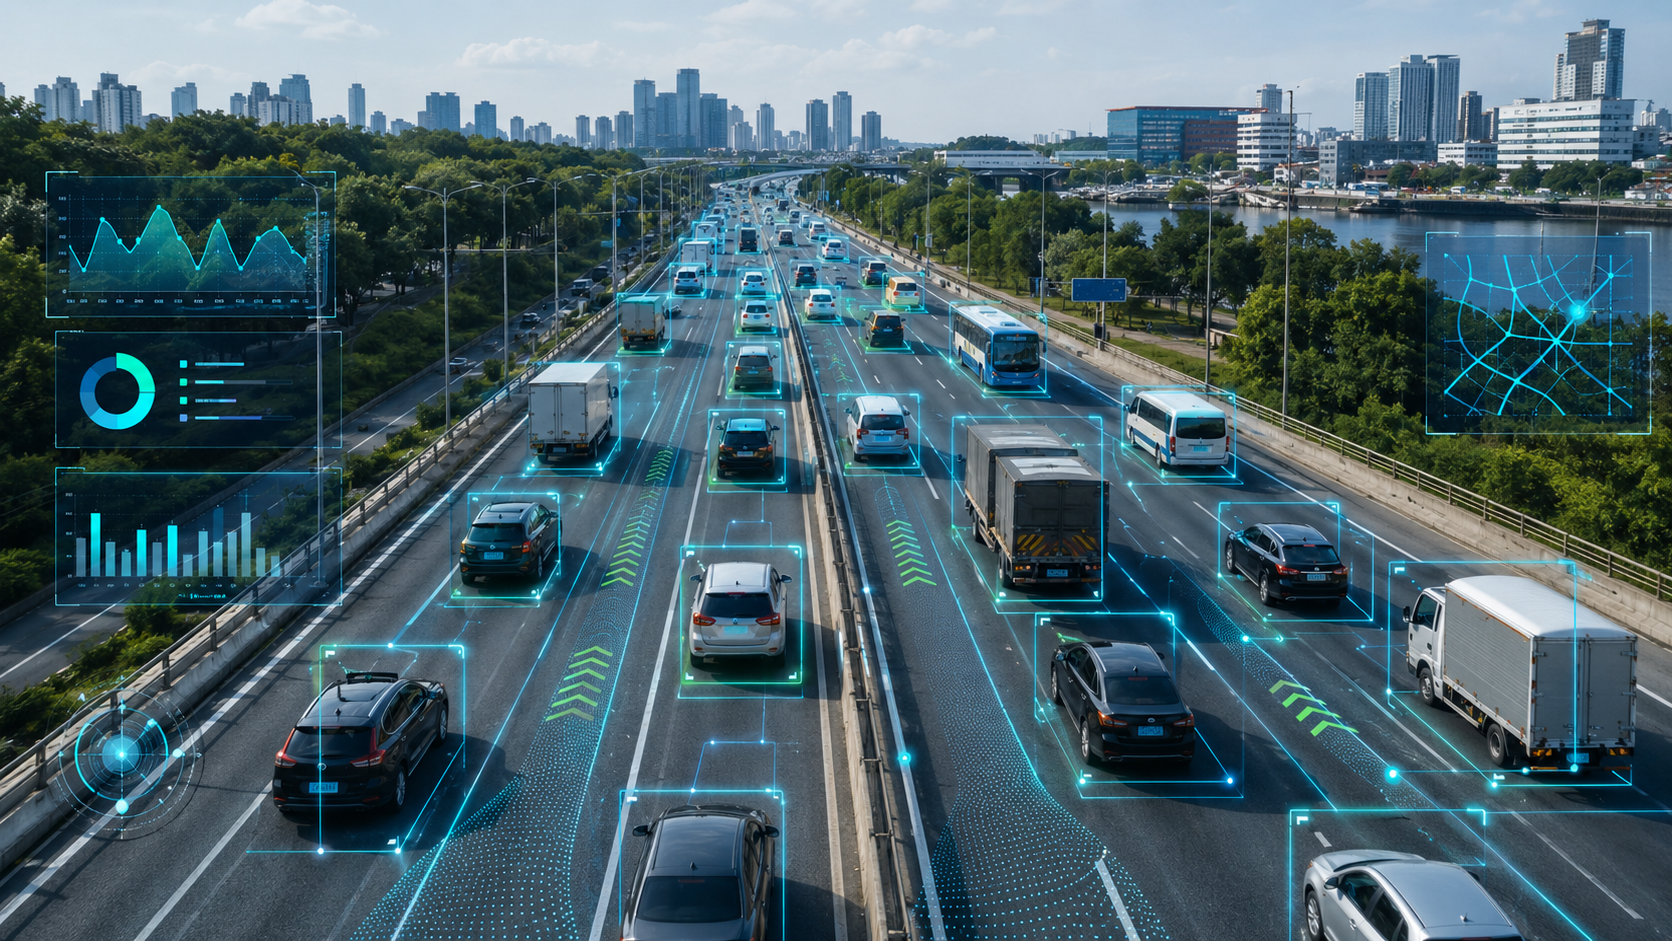
Transform existing CCTV into real-time intelligence about occupancy, visitor flow, queues, crowd density and the way people interact with physical spaces.
AerWatch® helps organisations understand not only how many people are present, but where they move, how long they remain, where congestion develops and how environments perform over time.
As AerVision’s Value-Added Distributor in Qatar, QRTD supports partners with solution design, demonstrations, licensing, technical enablement and manufacturer coordination.
More Than a People Counter
Basic counters provide a number. AerWatch provides context.
Using AI-powered video analytics, the platform can analyse people entering, leaving, gathering and moving between defined zones. Real-time information and historical trends can then support security, safety, staffing, planning and commercial decision-making.
AerWatch can use existing CCTV infrastructure to generate measurable data about visitor movement, dwell time and behaviour through dashboards and reports.
Entry and Exit Counting
Virtual lines and zones can be configured at entrances, exits, corridors, gates and other transition points.
AerWatch can record:
- Entries and exits.
- Direction of movement.
- Counts by individual entrance.
- Counts across multiple cameras.
- Hourly, daily and weekly traffic.
- Peak and off-peak periods.
- Current and historical occupancy.
- Visit and flow trends over time.
This helps organisations replace manual estimates with consistent, measurable information about the use of their facilities.

Live Occupancy Monitoring
AerWatch can calculate occupancy using entry and exit activity across defined areas.
Operators and managers can view:
- Current occupancy.
- Occupancy by zone or room.
- Capacity utilisation.
- Historical occupancy trends.
- Peak periods.
- Alerts when configured thresholds are reached.
Occupancy intelligence can support crowd safety, capacity management, staffing and service planning across airports, venues, retail centres, museums and public facilities.
Crowd Density and Overcrowding Alerts
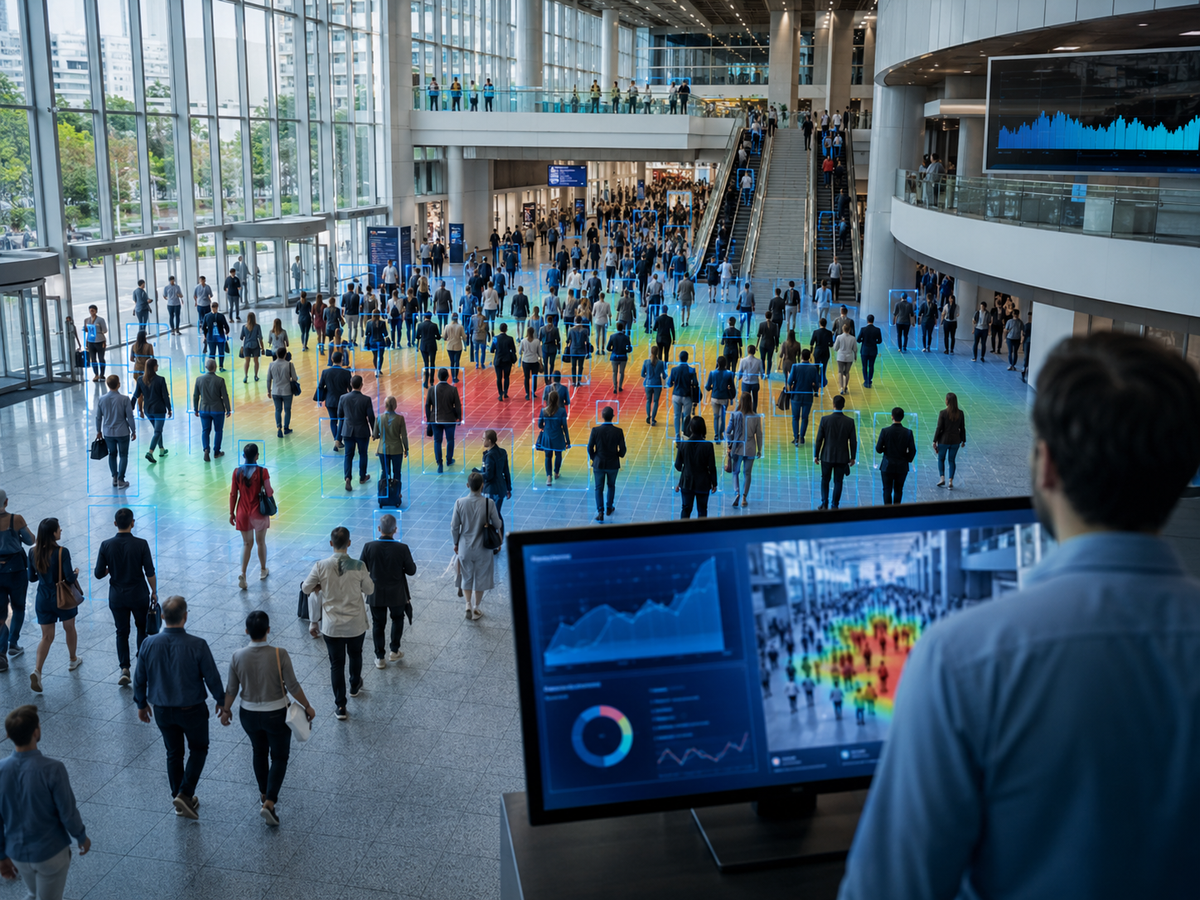
AerWatch can monitor the number and density of people within selected areas and generate alerts when crowd levels exceed defined thresholds.
This can help teams respond to:
- Unexpected crowd build-up.
- Overcrowded entrances.
- Congested corridors.
- Busy platforms or boarding areas.
- Excessive occupancy in rooms or halls.
- Sudden crowd surges.
- Unsafe gathering patterns.
Real-time alerts allow organisations to respond before congestion becomes a significant safety or service issue.
Queue and Waiting-Time Analytics
AerWatch can monitor queue length, queue duration and changes in waiting patterns.
The system can help identify:
- When queues begin to form.
- How long people are waiting.
- Which service points experience the greatest demand.
- When additional counters or personnel may be required.
- Whether operational changes reduced waiting time.
- How queue performance varies by time or location.
Queue analytics can support more responsive staffing and smoother service delivery at airports, hospitals, banks, retail environments and public-service facilities.

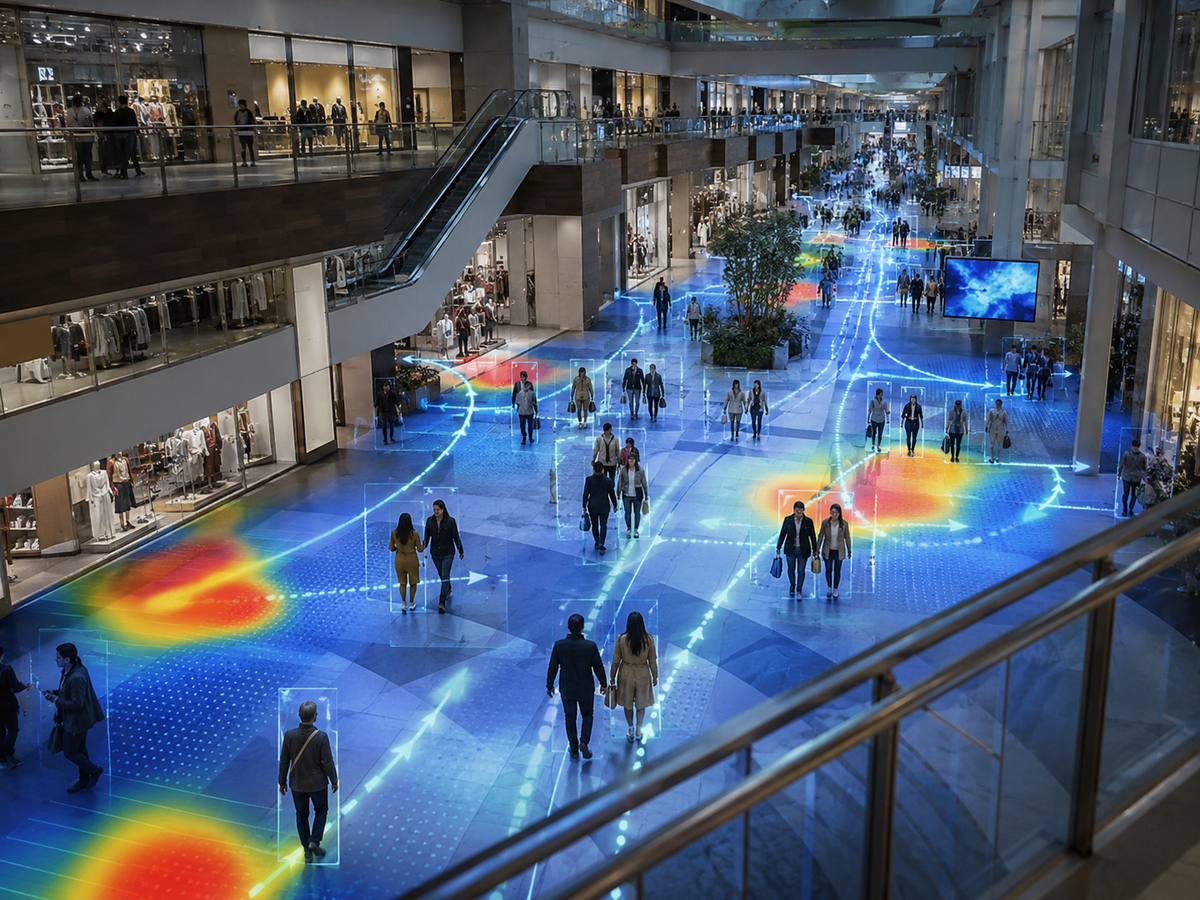
Heatmaps and Movement Patterns
Dynamic heatmaps show how people move through a space and how movement changes throughout the day.
They can reveal:
- High-traffic zones.
- Underutilised areas.
- Common routes.
- Bottlenecks.
- Stopping and gathering points.
- Peak and off-peak movement patterns.
- Changes following layout or signage modifications.
AerWatch heatmaps can also be exported or integrated with business-intelligence tools for further reporting and analysis.
Pathway and Visitor-Journey Analysis
AerWatch can follow movement between defined areas to provide a clearer picture of the visitor journey.
Pathway analysis can show:
- Routes taken after entry.
- Movement between zones.
- Direction changes.
- Stop-and-start behaviour.
- Drop-off points.
- Transition from one area to another.
- Movement before and after operational or layout changes.
This enables organisations to understand how people actually use their environment rather than relying on assumptions or anecdotal observations.
Dwell Time and Zone Engagement
AerWatch can measure how long people remain within specific zones.
Dwell-time information can help organisations understand:
- Which exhibits or displays attract the most attention.
- Where customers pause or engage.
- Which areas are passed through quickly.
- Where visitors hesitate or encounter friction.
- How long people remain in queues or waiting areas.
- Whether a new layout increased engagement.
Museums can use dwell time to assess exhibit engagement, while commercial environments can evaluate displays, promotional zones and customer journeys.
Zone Conversion and Campaign Analysis
AerWatch can measure how people move from one defined zone to another.
Examples include:
- Entrance to exhibition.
- Main corridor to retail unit.
- Display area to service counter.
- Event space to restaurant or gift shop.
- Promotional area to point of purchase.
- Check-in to security and boarding gate.
Historical comparisons can help organisations evaluate campaigns, events, exhibitions, layouts and operational changes using measurable footfall and engagement data.
Reporting, Forecasting and Benchmarking
AerWatch dashboards can provide real-time and historical visibility across multiple locations and periods.
Reporting may include:
- Daily and weekly visitor counts.
- Occupancy trends.
- Queue duration.
- Dwell time by zone.
- Heatmaps.
- Entry and exit activity.
- Campaign comparisons.
- Zone-performance comparisons.
- Peak-period analysis.
- Exportable reports.
Historical trends can support attendance forecasting, staffing plans, event logistics and capacity decisions.

Applications Across Multiple Environments
Airports and Transportation
Monitor terminal traffic, passenger flow, queues, gates, checkpoints, baggage areas and crowd build-up to improve safety and operational throughput.
Museums and Cultural Venues
Measure attendance, exhibit engagement, visitor routes and dwell time to support exhibition planning, staffing and funding decisions.
Shopping Centres and Retail
Analyse footfall, high-engagement zones, customer journeys, queue performance and the effect of promotional activity.
Government and Public Facilities
Monitor occupancy, waiting areas, service queues and crowd levels to improve resource allocation and visitor experience.
Events and Entertainment Venues
Track entrances, exits, crowd density and congestion before, during and after events.
Education and Campuses
Understand movement between buildings, identify congestion and support facility and timetable planning.
Cities and Public Spaces
Analyse pedestrian density, public-space utilisation and unusual crowd formation across plazas, streets and transport areas.
Security and Safety Intelligence
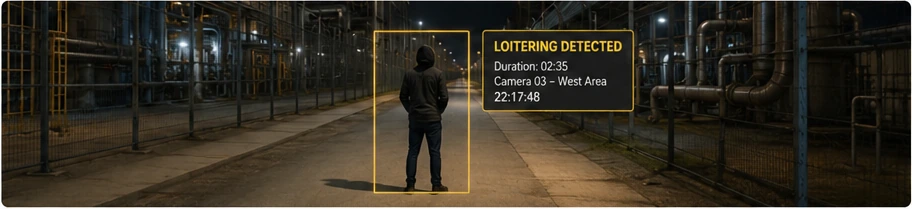
People counting and crowd analytics also support security and safety objectives.
AerWatch can help identify:
- Overcrowding.
- Sudden crowd surges.
- Abandoned objects.
- Loitering.
- Restricted-zone entry.
- Slips or falls.
- Unusual or irregular movement.
This allows the same camera infrastructure to support both operational intelligence and proactive incident response.
Privacy-Conscious Analytics
People counting does not necessarily require the identification of individuals.
AerWatch can provide behavioural and movement analytics while optional anonymisation features obscure faces or bodies in visual output.
This allows organisations to obtain useful occupancy and visitor-flow intelligence while applying privacy controls appropriate to the project and operating environment.
Integration and Scalable Deployment
AerWatch can be introduced over existing CCTV infrastructure and integrated with major VMS platforms, dashboards and reporting environments.
Deployments may range from:
- A single entrance.
- One building or venue.
- Multiple floors and zones.
- Large campuses.
- Distributed multi-site environments.
- Centralised enterprise reporting.
The final design should consider camera positioning, image quality, field of view, crowd density, network capacity and server resources.
Why AerWatch?
AerWatch combines counting with a wider set of operational and security analytics:
- Entry and exit counting.
- Live occupancy.
- Crowd-density monitoring.
- Overcrowding alerts.
- Queue and waiting-time analysis.
- Heatmaps.
- Pathway tracking.
- Dwell time.
- Zone engagement.
- Conversion analysis.
- Historical trends.
- Custom dashboards and reporting.
- Integration with broader video analytics and security workflows.
QRTD as AerVision’s Value-Added Distributor in Qatar
QRTD enables system integrators, security contractors and technology partners to deliver AerVision solutions in Qatar.
QRTD’s value-added distribution services include:
- Use-case assessment.
- Solution architecture and sizing.
- Camera and infrastructure review.
- Product demonstrations.
- Proof-of-concept coordination.
- Licensing and commercial support.
- VMS and security-system integration guidance.
- Technical enablement.
- Training and knowledge transfer.
- Coordination with AerVision.
- Third-level technical escalation.
QRTD supports the channel while installation, configuration, commissioning and local maintenance remain with qualified system-integration partners.
Request an AerWatch Demonstration
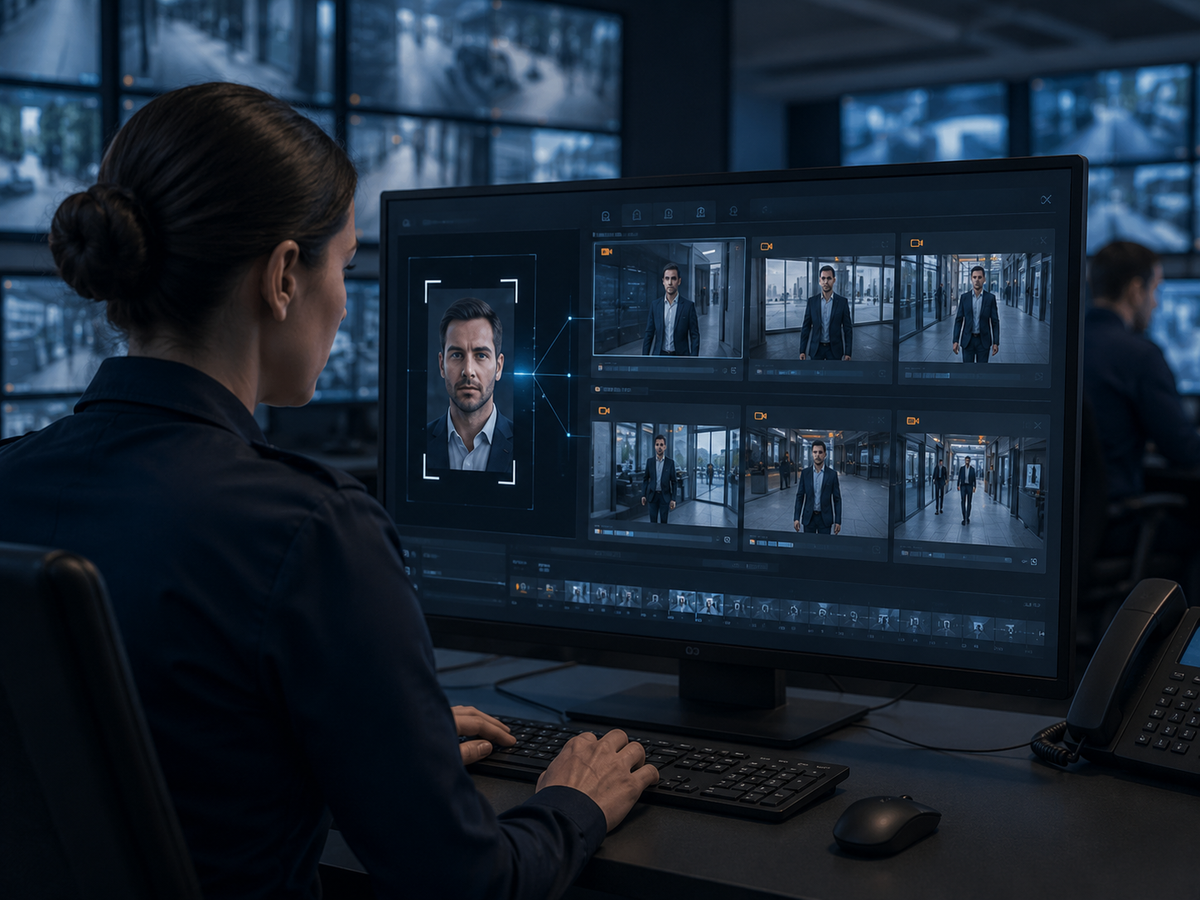
Discover how AerWatch facial recognition can improve person-of-interest detection, investigation and emergency accountability.
Contact QRTD Information Technology to discuss your requirements or arrange an AerWatch demonstration in Qatar.